
User Manual
Bazefield Alarm Log
INNHOLDSFORTEGNELSE
3 USING ALARM LOG
Alarm log is an efficient application for look up, analysis and reporting for all alarms and warnings from any of the turbines in the system. The filter is used to easily select desired turbines and time-periods.
The application consists of two views, Alarms and Statistics. Both views utilize the filter to show alarms for the applied turbines and time periods. Both views also make use of the alarm type filter.
4 ALARM LOG LIST
The alarm log list includes functions like search, filter, sort and export.
The alarm list shows an icon representing the alarm type, turbine, alarm code, alarm description and start- and end time. By default the list is sorted by start, with the newest alarms on top, but all columns may be sorted by clicking on the headings.
There are 3 types of alarm messages:
 Warning
 Stop
Stop
 Information
Use the search field to search for a specific alarm code or description.
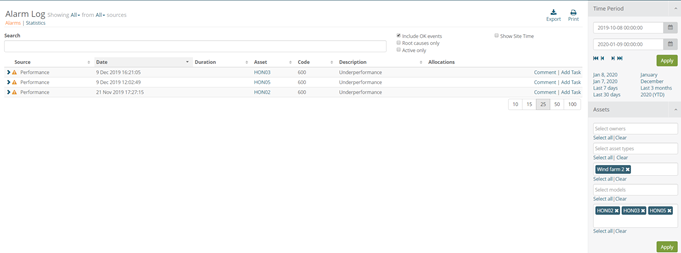
Figure 1 Alarm Log list
5 STATISTICS
The statistics page offers a convenient overview on what alarms are most common. It includes graphs for the top 10 alarm distribution, KPIs and a more detailed list of the visual presentation.
5.1 TOP 10 ALARMS GRAPH
The top 10 alarm graph displays the most common 10 alarms in a pie chart, bar chart or waterfall chart. The chart type is selected by these buttons.

By default the report displays the most common alarms by how many times the appeared (frequency). By switching to duration, the report shows the ratio between the length of the overall time of the alarms.
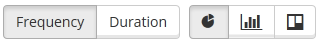
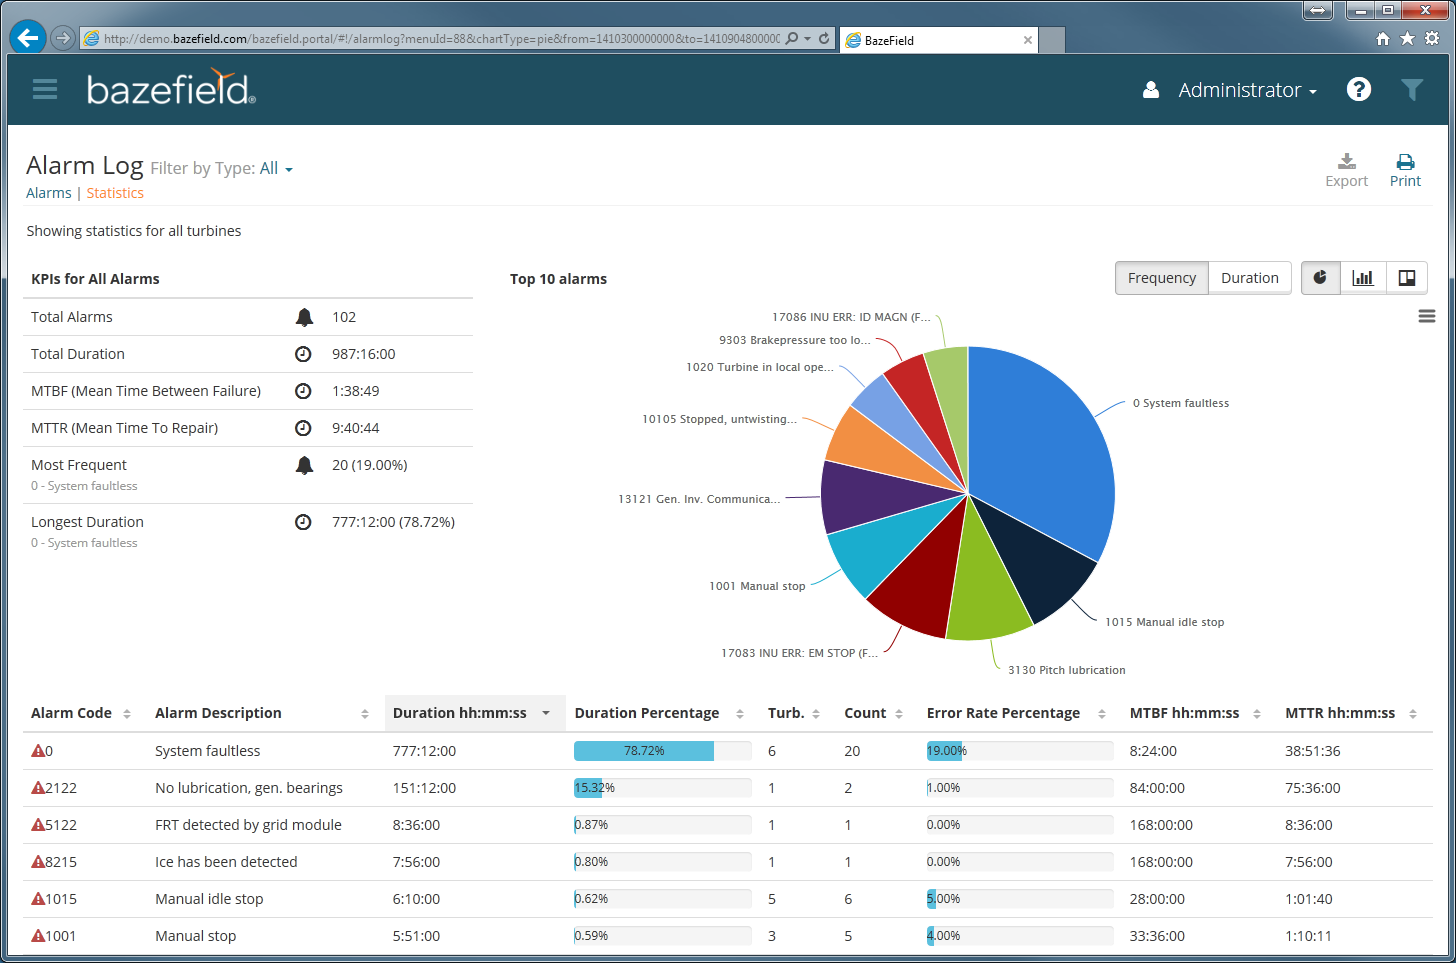
Figure 2 Statistics
The chart may be exported to images in different formats, pdfs or svg vector images by clicking on the button in the upper right corner of the chart, as shown in the image below.
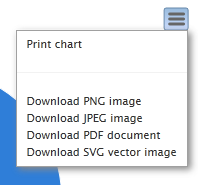
Figure 3 Exporting graphs
5.2 KEY PERFOMANCE INDEX
By default the KPIs shows information for all the alarms returned for the selected parameters in the filter. In the example below, the KPI area shows alarms for a turbine in a one month period.
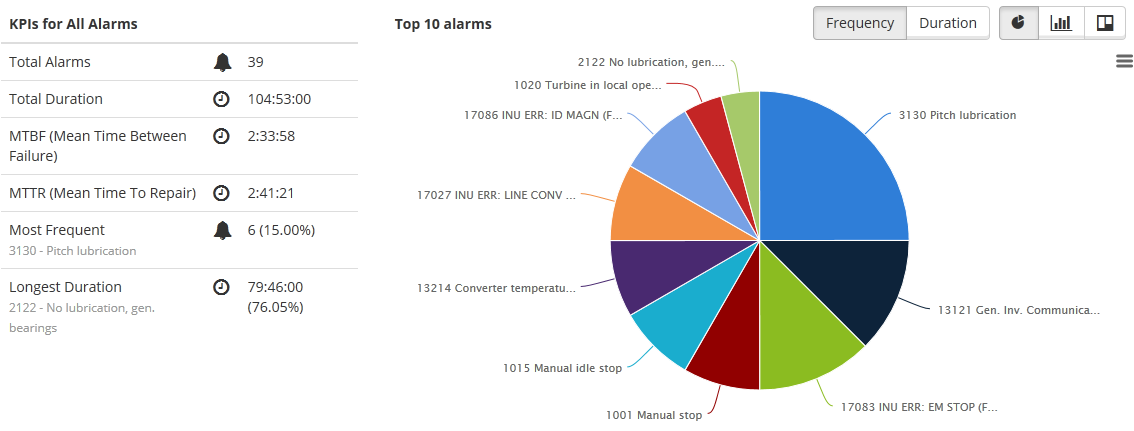
Figure 4 KPIs for all alarms selected by the filter
By clicking on a pie in the chart, the KPIs changes to only display KPIs for that specific alarm message. A blue information box also appears to make the user aware of this. Click once again on the selected pie or the provided link in the message to display the KPIs for all alarms.
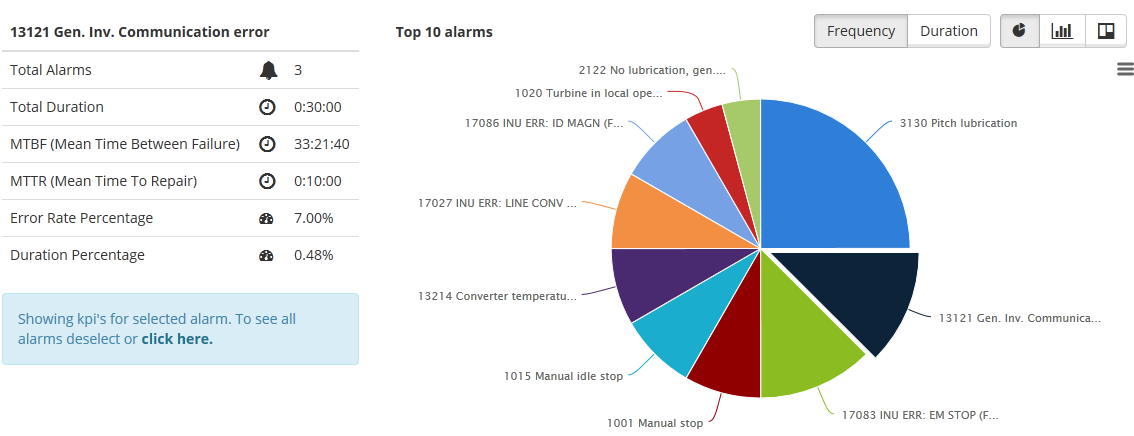
Figure 5 KPIs for a specific alarm message selected in the chart
5.3 DETAILS
The details list shows all alarms with the same KPIs as when selecting a pie in the chart.